Innovation Pipeline Management Software
Research Belongs in Your Pipeline. Not in Someone’s Downloads Folder.
Discover
Run a search or generate a report in 3DScout
Send
Click to send any record or report to a pipeline project
Evaluate
Score, discuss, and advance through your review stages
One Platform to Manage Your Entire Innovation Pipeline
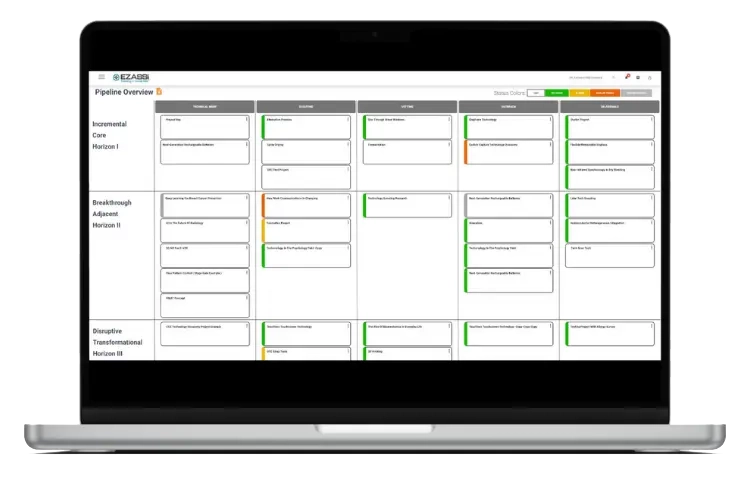
Kanban Pipeline View
Kanban Pipeline View Track every project through a visual, drag-and-drop pipeline. Each stage reflects where a technology or initiative stands in your review process — from first discovery through evaluation, validation, and decision. Because the stages are fully customizable, your pipeline mirrors your actual workflow rather than forcing your team to adapt to a preset system.
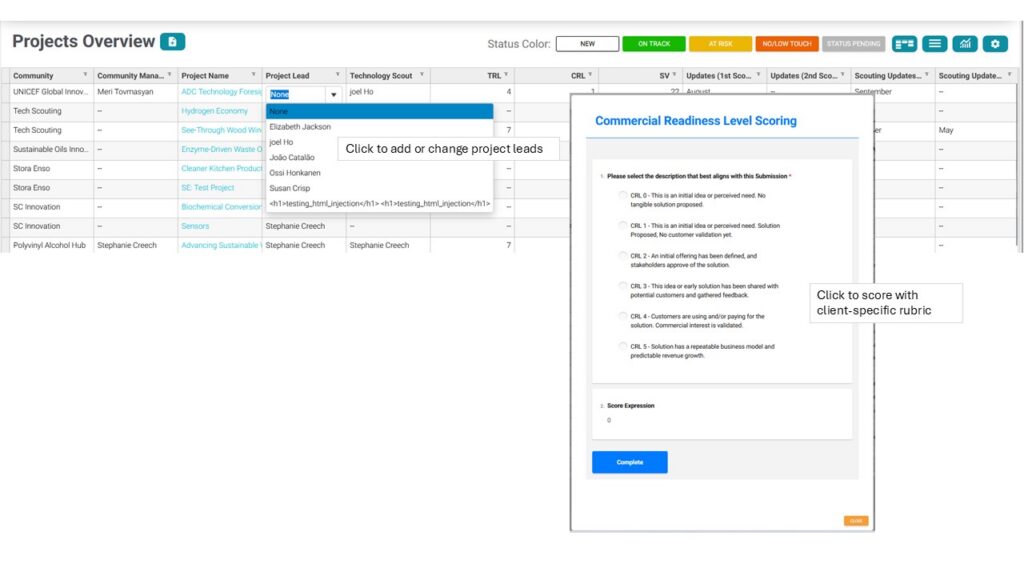
Grid View with Scoring
Grid View with Scoring For teams that prefer tabular review, the grid view displays every project across all communities in a single, filterable table. Each project carries a Technology Readiness Level (TRL) score, a Commercial Readiness Level (CRL) score, and a Strategic Value (SV) rating — so your team evaluates technology maturity and commercial potential side by side. Scoring is done against a client-defined rubric. Each level (CRL 0 through CRL 5, TRL 1 through TRL 9) has a written description your organization configures to reflect your own criteria — so scores mean the same thing to every reviewer on your team. Fields are edited inline directly in the grid, including project lead and technology scout assignments, without opening individual project items.
Collaboration and Discussion
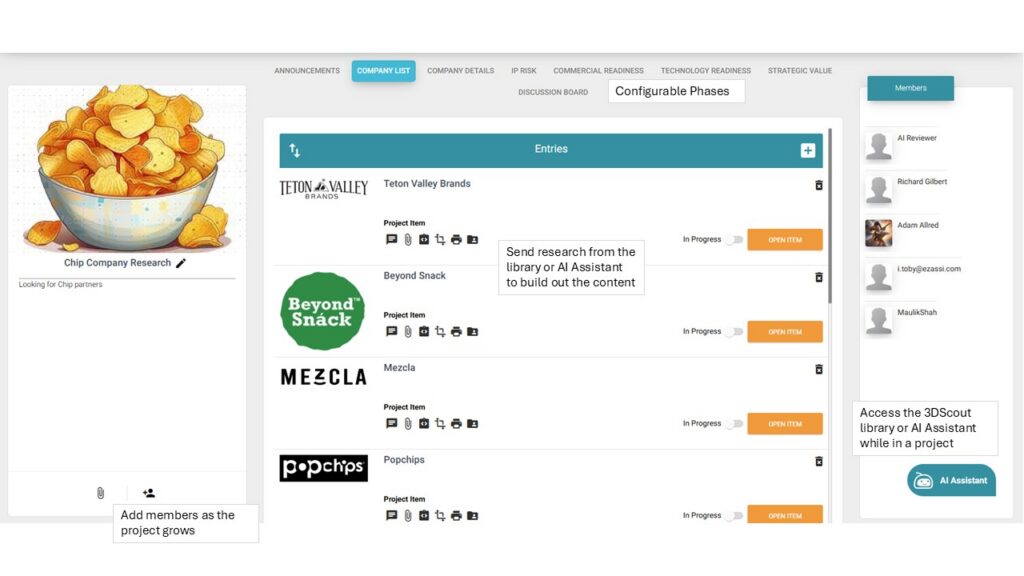
Collaboration and Discussion Every project item has its own discussion thread, comment stream, and file attachment capability — so the conversation stays with the work rather than scattered across email threads. Team members are added to projects as needed, and status updates are visible at a glance through color-coded project health indicators.
Analytics and Portfolio Charts
Analytics and Portfolio Charts The pipeline’s analytics view plots your entire portfolio by TRL and CRL — so leadership can see at a glance where technologies cluster, which projects are advancing, and where the portfolio has gaps. Charts are grouped by community or team, making it easy to compare progress across business units without building a separate reporting layer.
Every Project. Every Team. One View.
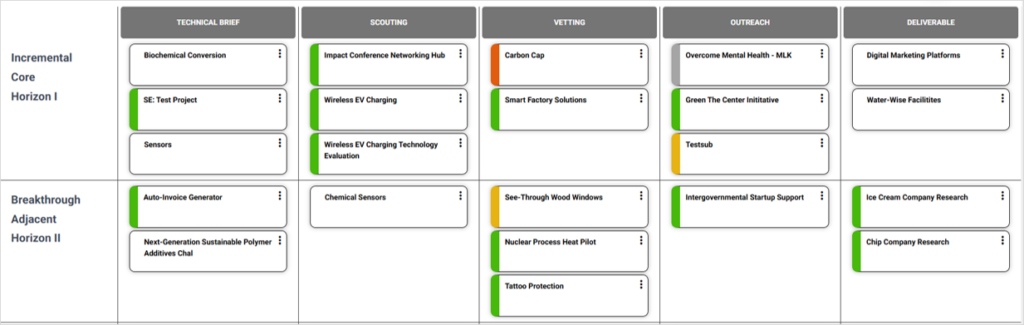
Your Innovation Pipeline, Your Stages
Already Tracking Projects in Excel? Import Them Directly.
- Upload existing project lists via Excel without manual re-entry
- Map spreadsheet columns to pipeline fields during import
- Imported projects are immediately available to all team members with access
- Continue adding records from 3DScout alongside imported projects in the same pipeline
See Your Portfolio’s Technology Readiness at a Glance
Ezassi’s pipeline analytics view plots your project portfolio across two axes: Technology Readiness Level (TRL) and Commercial Readiness Level (CRL). Each project appears as a bubble, sized by strategic value and grouped by community — so leadership can immediately see where technologies cluster, which projects are mature enough to advance, and where the portfolio is thin. The scores behind those bubbles are not arbitrary. Each TRL and CRL level is defined by your organization’s own rubric — configured once and applied consistently by every reviewer on your team. As a result, when a project appears at TRL 7 and CRL 4 on the chart, your CIO can trust that those numbers mean the same thing they meant last quarter and will mean next quarter. Because the chart updates in real time as projects are scored and moved through stages, it replaces the quarterly portfolio review spreadsheet with a live view your team can open any time. Consequently, the conversation in your leadership review shifts from ‘where does everything stand’ to ‘what do we do next.’
The analytics view plots every pipeline project by Technology Readiness Level (TRL) and Commercial Readiness Level (CRL), grouped by community. Bubble size reflects strategic value score. Charts update in real time as projects are scored and advanced.
What TRL and CRL Mean
TRL (Technology Readiness Level) measures how mature a technology is — from early-stage concept (1) to fully deployed and proven (9). CRL (Commercial Readiness Level) measures how close a technology is to market viability — from unproven concept through active commercial deployment. Plotting both together gives your team a complete picture of where a technology stands on the path from discovery to decision.
Your Research Is Only Useful If Your Team Can Find It
Per-Project Discussion
Each project item has its own comment stream and chat thread. As a result, discussion stays attached to the work — not buried in a shared inbox or a general Slack channel.
Surveys and Structured Capture
Teams can attach surveys to project items for structured evaluation. Whether you need a scored assessment or an open-ended review, the survey stays inside the project and feeds the team’s evaluation record.
File Attachments
Reports, presentations, prototypes, and supporting documents are uploaded directly to the project item. Every team member with access sees the same set of files — no version confusion, no emailed attachments.
Flexible Team Access
Project membership is managed on the fly. Add team members as a project advances and the review circle widens. Members see the full project history from the moment they join.
The Pipeline Is One Part of a Fully Connected Innovation Platform
3DScout
3DScout Technology Discovery Search 360 million records across patents, publications, grants, clinical trials, and more. Send any finding directly to a pipeline project in one click. → /technology-discovery-software/
AI Technology Scouting
AI Technology Scouting Reports Generate structured intelligence reports on demand — Overview, Trend Scan, Deep Insights, Company Profile, or University Profile. Send the report directly to a pipeline project for team review. → /ai-technology-scouting-solutions/
Agentic Innovation Monitoring
Agentic Innovation Monitoring Once a technology or company enters your pipeline, set it to monitor automatically. Ezassi tracks patent filings, announcements, and competitive signals continuously — and surfaces updates directly in your pipeline. → /agentic-innovation-monitoring/
See How Ezassi Connects Research to Pipeline Decisions