Dr. Robert Blizek, a former senior technologist with NAVAIR, shares the lessons learned that drove his decision to use Ezassi’s Knowledge Scouting application.
The Challenge
Growth of World Population and the History of Technology
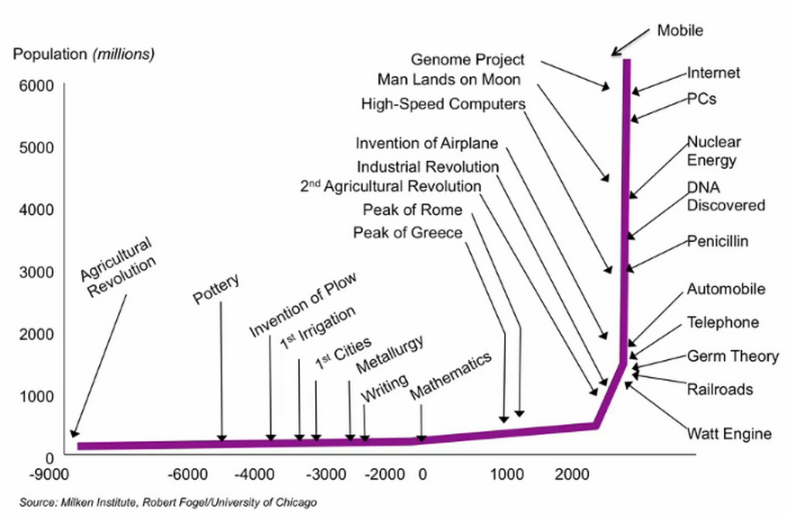
Figure 1. Globalization and the Internet have dramatically accelerated technology development.
There are three challenges to address if one is to keep abreast of technology development for investments, optimal partnership selection, or roadmap planning. First, critical technological advances can come from anywhere. A recent study by the government accounting office (GAO) noted that, only two decades ago, 70% of science and technology development for the DoD was developed exclusively within DoD- industry partnerships. Today, that 70/30 split is reversed with the private sector eclipsing the DoD’s pace of breakthrough technologies in areas such as artificial intelligence, quantum engineering, and cyber security.
The second challenge is that science and technology (S&T) development is now a global commodity. That is, international collaborations among academic, national research labs, and corporations have expanded dramatically in the last decade. Cross border collaborations now dominate the S&T landscape in terms of funding, resources, and personnel. The math is simple, there is far more private sector research going on around the world than there is within the DoD sector.
The increasing pace of new development across the globe is a third challenge (Figure 1). Recent studies have shown that as the world population has grown, Moore’s law has shortened due to globalization and the Internet. In some cases, Moore’s Law is now measured in weeks and months instead of years.
Faced with these realities, the “rubber meets the road” questions for each portfolio manager are the same.
- Who should I watch?
- Do I know what I don’t know?
- How can I keep pace with all the development in the world so I can pick the best collaborative partners?
- Can I improve the return-on-investment of my portfolio by leveraging the progress of others while focusing only on one’s unique aspects of the problem?
To find the research tool to answer these questions, there are some things that one should know.
Search Engine Bias
When I took on the role of senior technology advisor at NAVAIR , our only research tool at the time was Google (as well as other popular search engines) to map the technology landscapes of interest. But there was a problem. Google describes its own coverage of the on-line universe as only 15-20%. That means that the vast majority of results never show up due to geo-blockers, relevance filters, and their own proprietary prioritization schemes. That is a lot left on the table. In fact, the effects of Google on our data was worse than we thought.
While Google was a useful starting point, my team and I began to notice a bias toward sensationalism of certain technologies. For example, quantum computing captured the media’s imagination of solving the unsolvable. There were news stories of the race among IBM, Rigetti, D-wave and others that insinuated that practical quantum computing was just around the corner. The implication of the news hype was that great strides were being made and progress was rapid. As a result, we assigned high TRLs (technology readiness levels) and began to direct funding to these areas based upon what we found. We were wrong.
When we dove into the data, we quickly realized that commercial search engines, such as Google, are made to entertain and inform the general public. There are built-in biases and filters that make them questionable research tools. We discovered the hard way that Google skewed the data. This is why any portfolio research requires a knowledge scouting application. For our S&T research, I chose the Ezassi Technology Scouting application for several reasons.
First, we needed a tool that allowed the construction and evolution of simple to complex queries. We found that research often evolves from the general to the specific as the researcher’s first step is to get an overview of the general topic’s profile and then, later, to refine his search to specific interests. As a result, the ability to edit a given query, to explore a branch of the topic, and then to return to previous queries is important for organizing and ensuring that all topic variations are explored. The Ezassi tool allows users to evolve their searches with an easy to use point and click interface that includes suggestions from the Foam Chart as well as the relevant keywords per year listing (Figure 2). In addition, we found that the Topic Trends chart was useful as it provided indications of how the interest in the topic evolved over time up to the current date.

Figure 2. Ezassi allows users to evolve their searches with an easy to use point and click interface. In addition, the Foam Chart provides a view of the variety of related topics to explore. If finding relevant terms to enhance your query remains problematic, we found the relevant keywords per year listing (below) to be a useful list of query suggestions. We found that the Topic Trends chart (above) was useful as it provided indications of how the interests in the topic evolved over time.
Second, when comparing research engines, don’t be fooled by a sales pitch that promises more search results than a competitor. Query results are often a balancing act between a sparse array of relevant records and an overabundance of irrelevant returns that just takes up a researcher’s time to filter manually. In this respect, we found the Ezassi tool provided an optimal mix when compared to other research engines. We came to appreciate the wide variety of ways to filter the results. The full range of Boolean logic, including “NOT” conditions, could be generated by the search interface. The ability to filter out News and Web sources turned out to be more useful than we originally thought.
Third, there is a difference in the applicability of results depending on the source organization. Keep in mind that academic institutions claim success if a process works even once. Such academic work does not necessarily represent an exploitable advance because their goal is to publish. Small businesses and startups are eager to capture patents as greater reliability is achieved. As a result, small business results are excellent pre-conditions of potential new technologies since they tend to claim speculative patents in case the technology becomes of practical benefit. Further in the maturity cycle, corporations seek to acquire patents that either enhance their existing product line or extend their offerings into new areas. For these established firms, incorporating a patentable advance into a product indicates a capital risk that requires a greater understanding of the process, repeatability, and a greater level of technological maturity than small businesses and academia.
The point is that a given knowledge scouting tool needs to break down the sources of patents, white papers, and grants by organizational categories because the distribution will indicate the level of maturity an innovation has achieved as well as its level of interest. This is a function Ezassi does very well with a variety of filters and infographics (Figures 3).
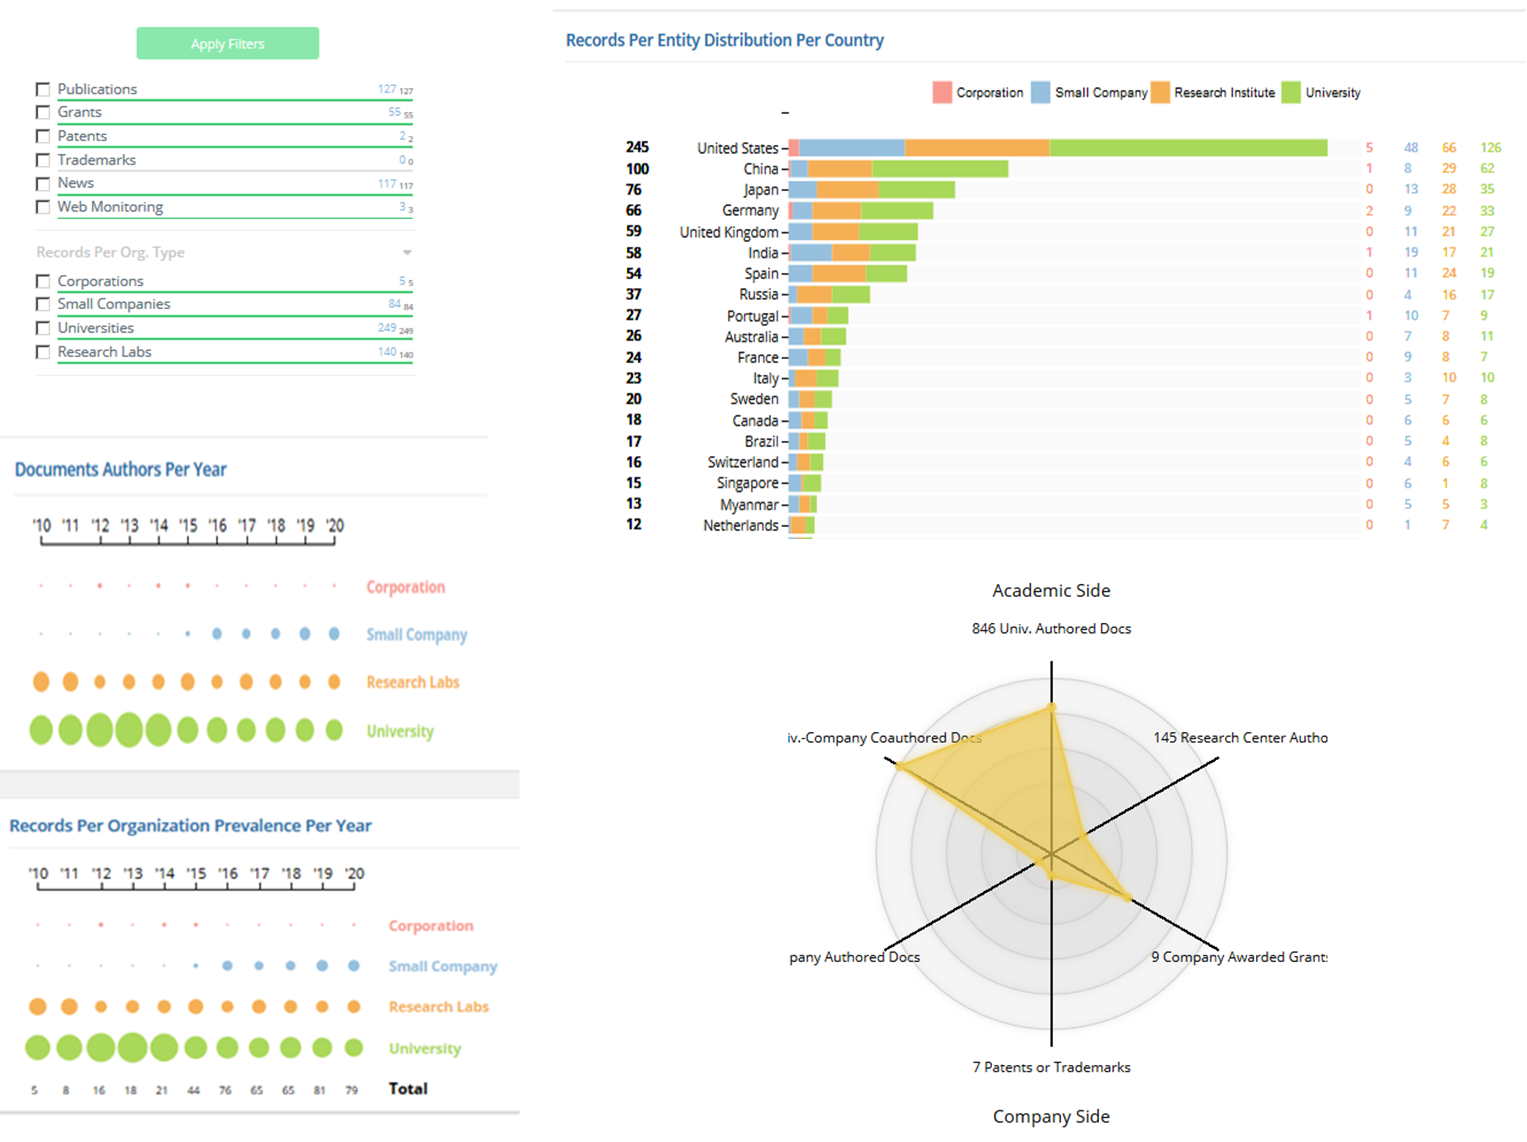
Figure 3. Ezassi enables researchers to repeat their queries using a variety of filters for media sources as well as organizational entities. Ezassi’s filter driven infographics provides insight into how the query records are distributed by organizational type (above) as well as by country.
Fourth, to select the best possible partners and improve our ROI, we also needed to understand who was working with whom and why. In this respect, the Ezassi network charts provided excellent visuals that indicated the scope and nature of collaboration for every record producer found by the search engine. Going further, the tool also enabled researchers to drill down to the nature or scope of any given collaboration in the network. Ezassi does this by providing a keyword as the mouse hovers over the network connector line. Because the network visual can be rather cluttered, the tool also lists the network member selected and enables the user to filter the members by organization type (academic, government lab, small business, etc.). Ezassi goes a step further as network nodes can be back-traced to their respective organizations along with the intellectual property attributed to the association. With these insights, the collaboration network often provides insights into who are the dominant and secondary contributors, general strategy, and the range of possible end applications (Figure 4). These network functions were the most often requested features of the Ezassi tool.
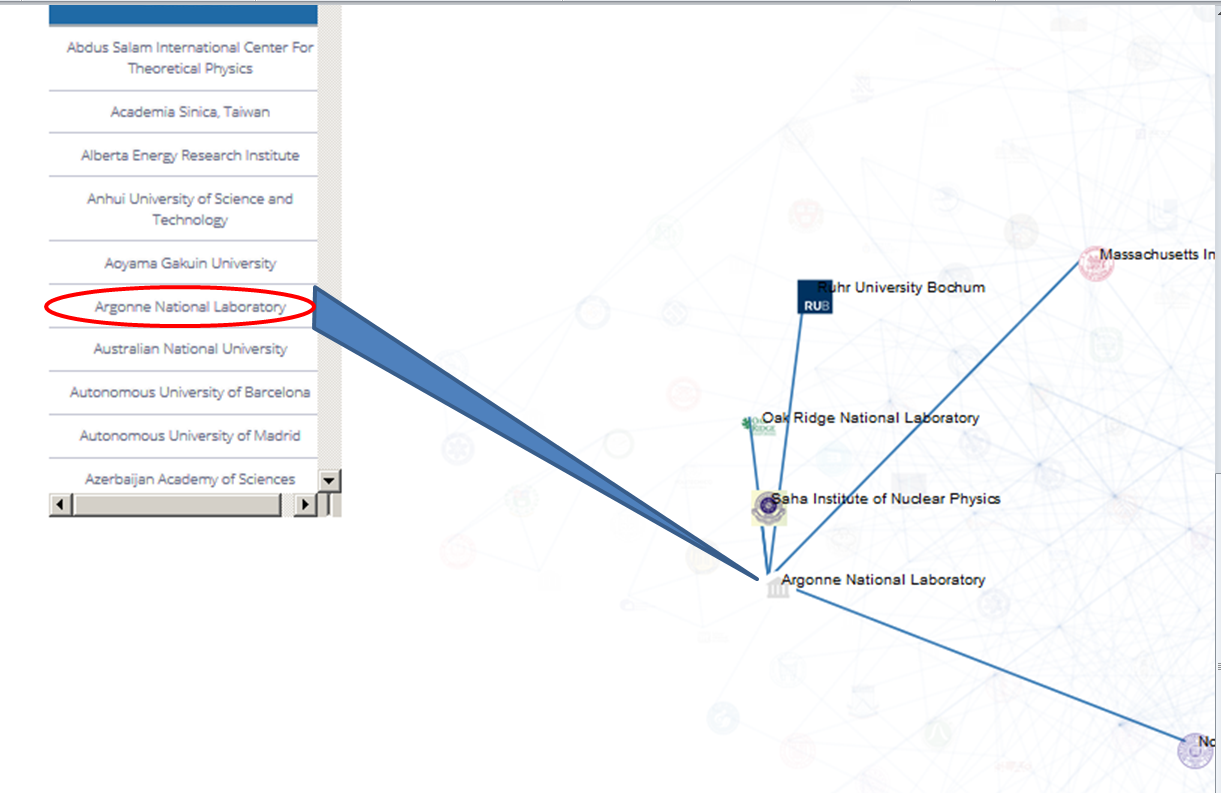
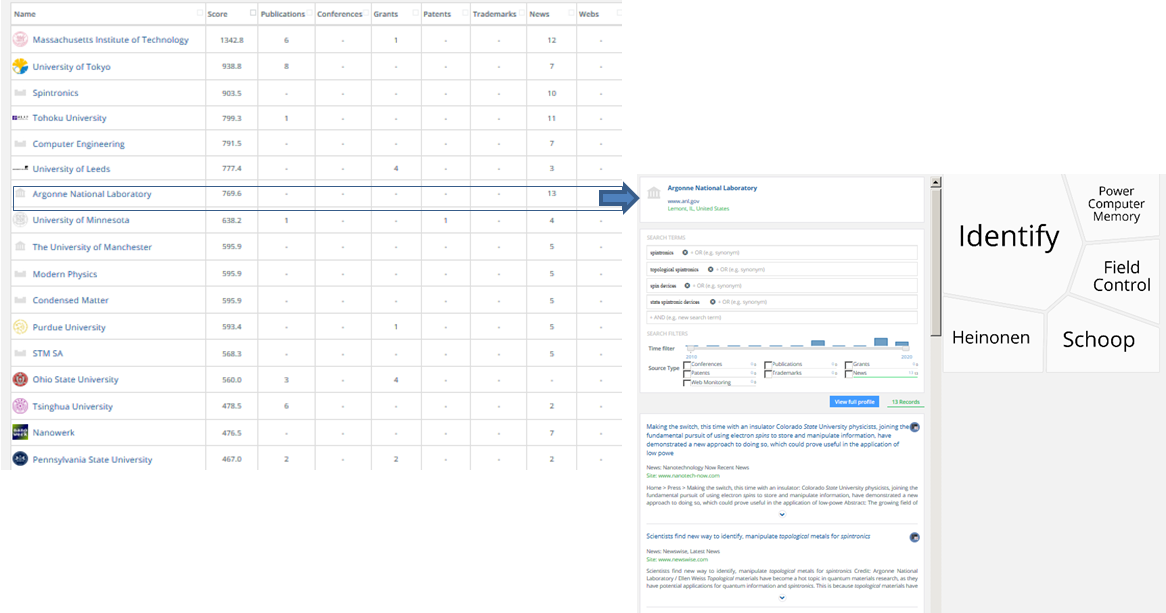
Figure 4. Network nodes can be selected from the network (above) and back-traced to their respective organizations along with the intellectual property attributed to the association. This was the most popular feature of the Ezassi application.
Fifth, the trouble with hardcopy reports is that they often are not read. In fact, the bigger the report, the less likely it will be assimilated. Furthermore, as the duration of Moore’s law decreases the more likely the document will be obsolete shortly after its publication. This experience drove us to a different and more useful publication function. Instead of pushing reports out to be read and retained to be useful, we transitioned to an on-call database portal that could easily be accessed by any of our portfolio managers as the need arose. The data base could be updated as new developments occurred and could trigger alerts to individual prescribers according to their interests. The key to populating the database was Ezassi’s ability to generate a report as well as to enable researchers to periodically repeat saved queries and capture the results in an exportable Excel spreadsheet (Figure 5). We then began to develop macros within the database to compare changes in collaboration profiles, patents, and media sources with an ample supply of graphics, taken directly from Ezassi, to tell the story at a glance. As a result, we could create an on-line e-magazine of short, to-the-point reports with links to more detailed information. In terms of manpower, publishing reports went from over 100 hours to an average of 10 man hours per topic. In terms of cost, Ezassi research tool paid for itself with better results in less than two months.
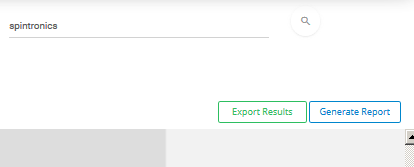
Figure 5. The key to populating the database was Ezassi’s ability to generate a report as well as to enable the researcher to periodically repeat saved queries and capture the results in an exportable Excel spreadsheet.
Conclusion
In conclusion, my team and I learned much about research engines and what to consider in selecting one.
We learned, the hard way, that popular search engines have an innate bias toward sensationalism to attract more readers. Using these commercial search engines will bias the objectivity of one’s research and cause you to overestimate the technical maturity of most advances. The Ezassi Knowledge Scouting application enabled my team and I team to be objective.
Our experience with Knowledge Scouting tools is that they do not replace other research sources. However, they often provide findings that the research teams would not have discovered otherwise. For us, that made the Ezassi Knowledge Scouting tool essential for creating competitive advantage.
The nature and composition of collaborations on any given subject provides great insight into the focus of technology leaders, the technical maturity of advances, and the possible range of innovative applications. Ezassi’s social network charts proved to be one of the most valuable capabilities to track S&T advances around the world.
Lastly, the manual search and copy process is too slow, too manpower intensive, and too prone to obsolescence to be an effective guide for modern portfolio planning as well as for guiding the work of on-going S&T work. Ezassi’s Knowledge Scouting application’s ability to export to a spreadsheet and auto-generate reports with understandable infographics were essential for us to model the findings for timely human consumption. We have liked the research application so much that we have extended its use to our technical library so it could be used to benefit technology planners and engineer base-wide. Thank you, Ezassi. You got us to a place we could not have gotten to on our own.

Dr. Blizek can be reached on LinkedIn at //www.linkedin.com/in/robert-blizek-94722877/


